|
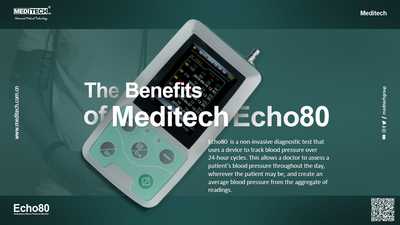
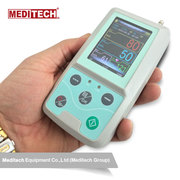
ECHO80 AMBULATORY BLOOD PRESSURE MONITOR
Many studies have now confirmed that blood pressure measured over a 24-hour period is superior to clinic blood pressure in predicting future cardiovascular events and target organ damage.
It's mainly for pediatric hypertension, but a good reference on the subject. It is important to understand the application of the device and how it can benefit the patient and the doctor in diagnosis and treating hypertension.
Echo80 Ambulatory Blood Pressure Monitor is a great product to start 24 hour BP monitoring with.
The Echo80 can store over 600 measurements, including 300 records of common user and 358 of ambulatory blood pressure data. Every record includes the time, systolic blood pressure, diastolic blood pressure, mean blood pressure, pulse rate and record number. The records can be saved and uploaded to a computer for analysis and reporting.
Echo80 Ambulatory Blood Pressure Monitor patient monitor is a tremendous device for recording blood pressure during exercise when the heart beats with increased force to raise blood pressure.
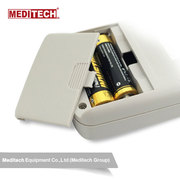
Compact, portable and easy to use
Programmable test interval of 15, 30, 60, 120, 240
Two working modes, monitoring function and 24 hours ambulatory NIBP measure
Friendly user interface provides menu list and measure results
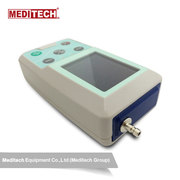
USB cable for uploading data to computer
Select-able for Adult, Pediatric or Neonatal (See Optional Cuff's)
Software Included for data analysis, report printing, and trend graphing
The device can be connected to practically any PC with windows OS.
The Ambulatory Blood Pressure Monitor is provided with interface cable for data upload, software that provides flexible programming with comprehensive analysis and presentation/reporting functions.
The accuracy of the algorithm used has been clinically validated to the BHS and AAMI criteria.
The chart on the left provides trend data of all the readings selected of analysis. Remember the Echo80 record interval can be set from 15 to 240 minutes. The right chart is a correlation line or cloud chart. This is a great tool for visualizing all the data points in the analysis set.
The histogram and pie charts provided may help you or the patient visualize there 24 hour BP readings. This is a standard feature of the analysis software.
|


